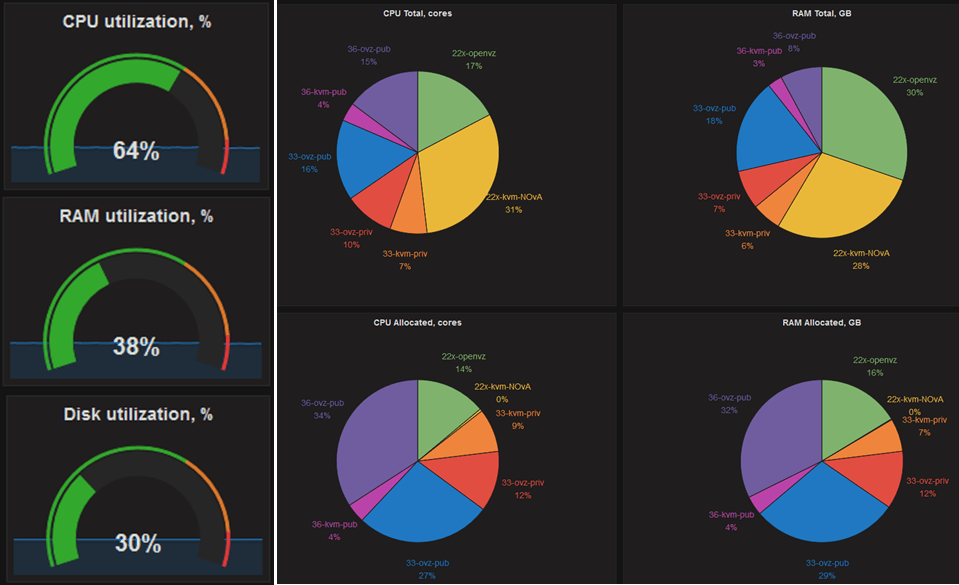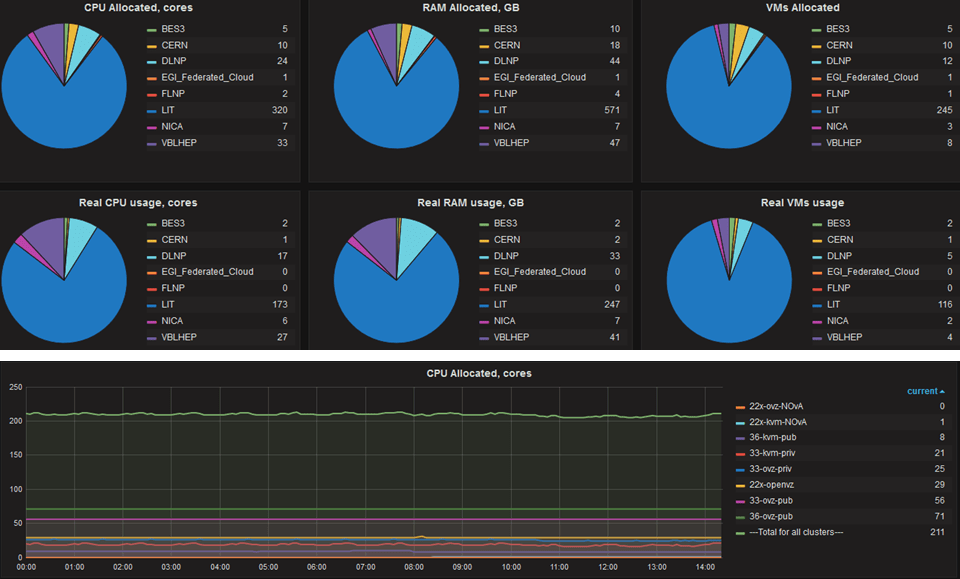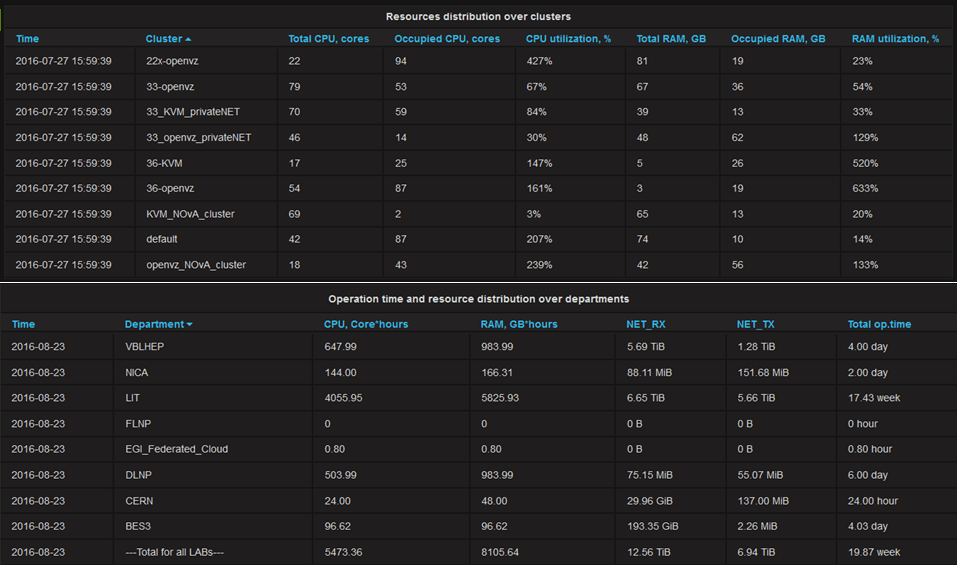
Visualization of cloud resources utilization
To visualize statistics on a distribution of resources of the JINR cloud the Grafana system was chosen. It provides a user-friendly interface through a web browser displaying various kinds of statistical metrics in real-time, gives flexible and functional ways to customize the layout of charts and graphs.
As data-storage to store gathering information from OpenNebula was chosen InfluxDB. It is an open source database specifically to handle time series data with high availability and high performance requirements. InfluxDB is meant to be used as a backend storage for many use cases involving large amounts of timestamped data, including DevOps monitoring, application metrics and real-time analytics. It has a simple, high performing write and query HTTP(S) APIs.